Free Revenue Plan Template for Consulting Firms (Excel Spreadsheet)
A free revenue plan template that sets your target against what your pipeline can actually deliver, then shows the gap in total and month by month. One Excel workbook, four tabs, seven steps.
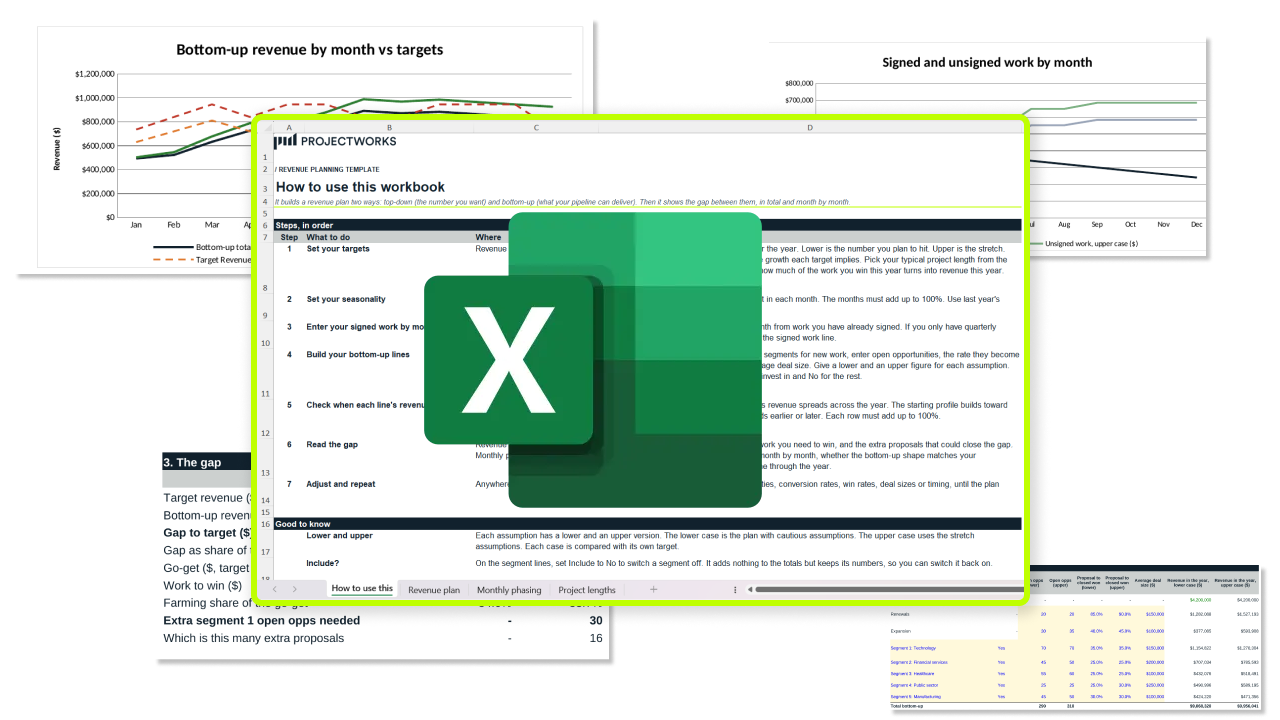
What’s inside the revenue plan Excel workbook?
Four tabs, filled with example figures you replace with your own:
- How to use this
Seven steps in order, each pointing to the tab and section to fill in. - Revenue plan
Your targets, the bottom-up lines and the gap. - Monthly phasing
Seasonality, signed work by month, when each line’s revenue lands, and four charts. - Project lengths
The assumptions behind the project length dropdown.
Inputs are blue cells on a yellow fill, and everything else is a formula.
What is the revenue plan template for?
Use it to check whether your pipeline can deliver next year’s target before you commit to the number. For each target, it shows:
- The gap between the target and what your pipeline can deliver, in dollars and as a percentage.
- The work you need to win, allowing for the fact that work won late in the year mostly delivers next year.
- How much of that your existing clients cover through renewals and expansion.
- If you’re short, how many extra opportunities and proposals in your first new-client segment would close the gap.
- Whether you’re ahead or behind, month by month.
How to fill in the revenue plan template
1. Set your targets
On the Revenue plan tab, enter a lower target you’re confident you’ll hit and an upper target for a good year. Then pick your typical project length.
2. Set your seasonality
On the Monthly phasing tab, enter each month’s share of last year’s revenue. The 12 months must add up to 100%.
3. Enter your signed work by month
Enter the revenue you expect each month from work already signed. If you only have quarterly figures, divide each by three.
4. Build your bottom-up lines
Back on the Revenue plan tab, start with renewals and expansion. Then add up to five new-client segments and set Include to Yes for the ones you’re backing. For each line, enter:
- Open opportunities, the conversations that could become proposals
- Rate to proposal, the share you expect to turn into one
- Win rate, your own from the last 12 months (our research puts the average at 47%)
- Average deal size
5. Check when each line’s revenue lands
On the Monthly phasing tab, each line's row spreads its revenue across the year. The example rows assume 6-month projects and don't change with the dropdown, so edit them if yours run shorter or longer.
6. Read the gap
The Revenue plan tab shows the totals. The Monthly phasing tab shows the gap month by month, with charts and check cells that read OK when everything adds up.
7. Adjust and repeat
Change your numbers or switch segments on and off until each target looks achievable. Then take the work to win into your delivery and hiring plan, the subject of part 2 of the 2027 Planning Bootcamp.
How do I track the plan through the year?
The template is a plan built on numbers you type in once, so it won't move when your deals and projects do. In Projectworks, CRM and Proposals tracks deals by stage and turns a won deal into a project with its budget already in place, and reporting shows current and projected revenue on your projects.
FAQs


Explore similar resources from Projectworks
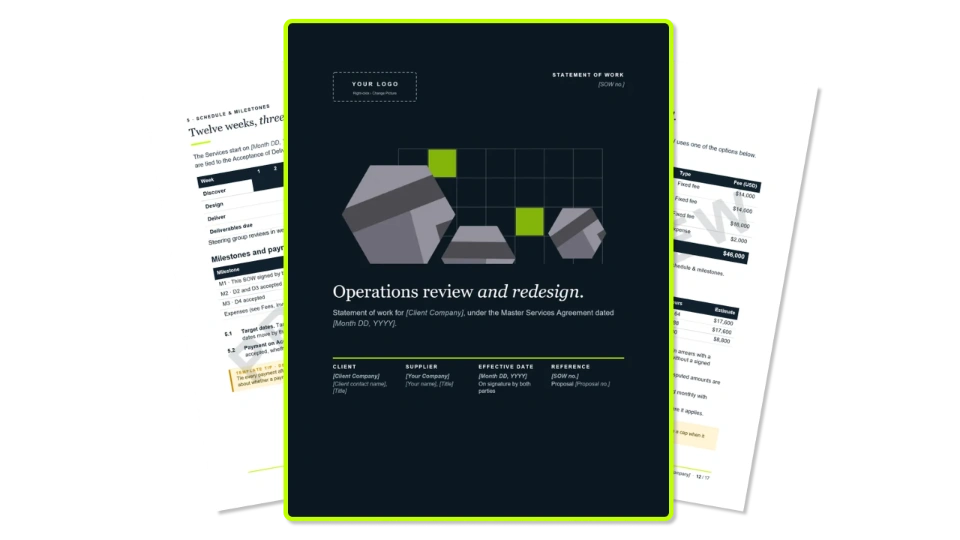
A 16-page statement of work template for consulting firms, with testable acceptance criteria, change control and a change request form. Free in Word and PDF.
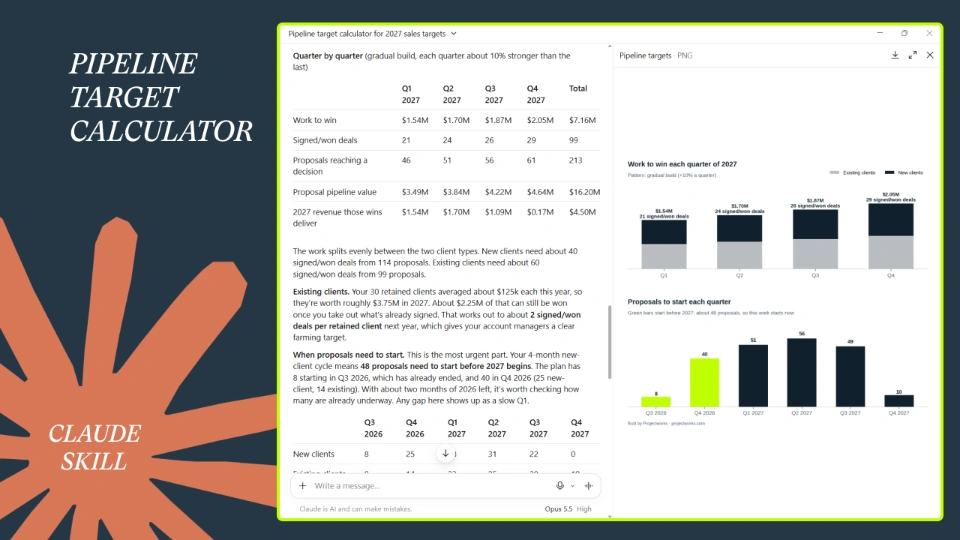
Turn your 2027 revenue goal into the proposals, pipeline and deals you need each quarter. Built for heads of sales, BD leads and founders who'd rather plan the year than guess at it.
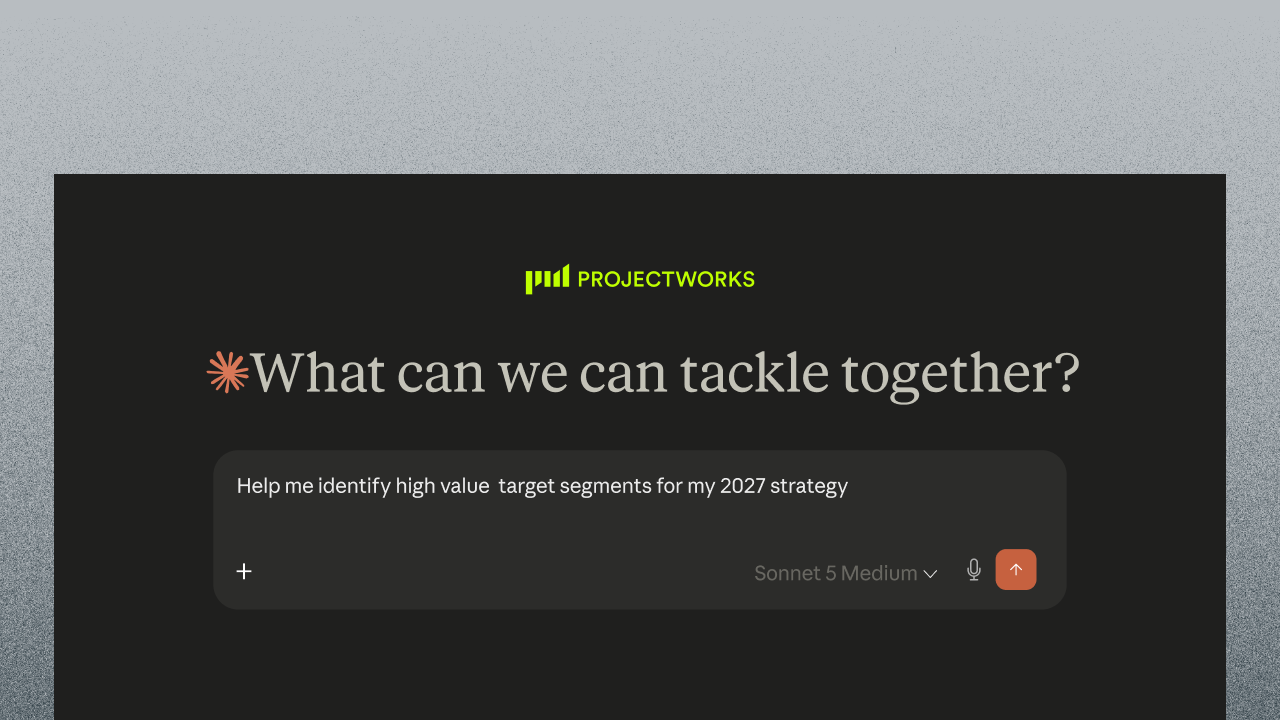
Find out which clients made you money last year and which ones to go after next. A free skill for Claude, with a report you can read and action in ten minutes.